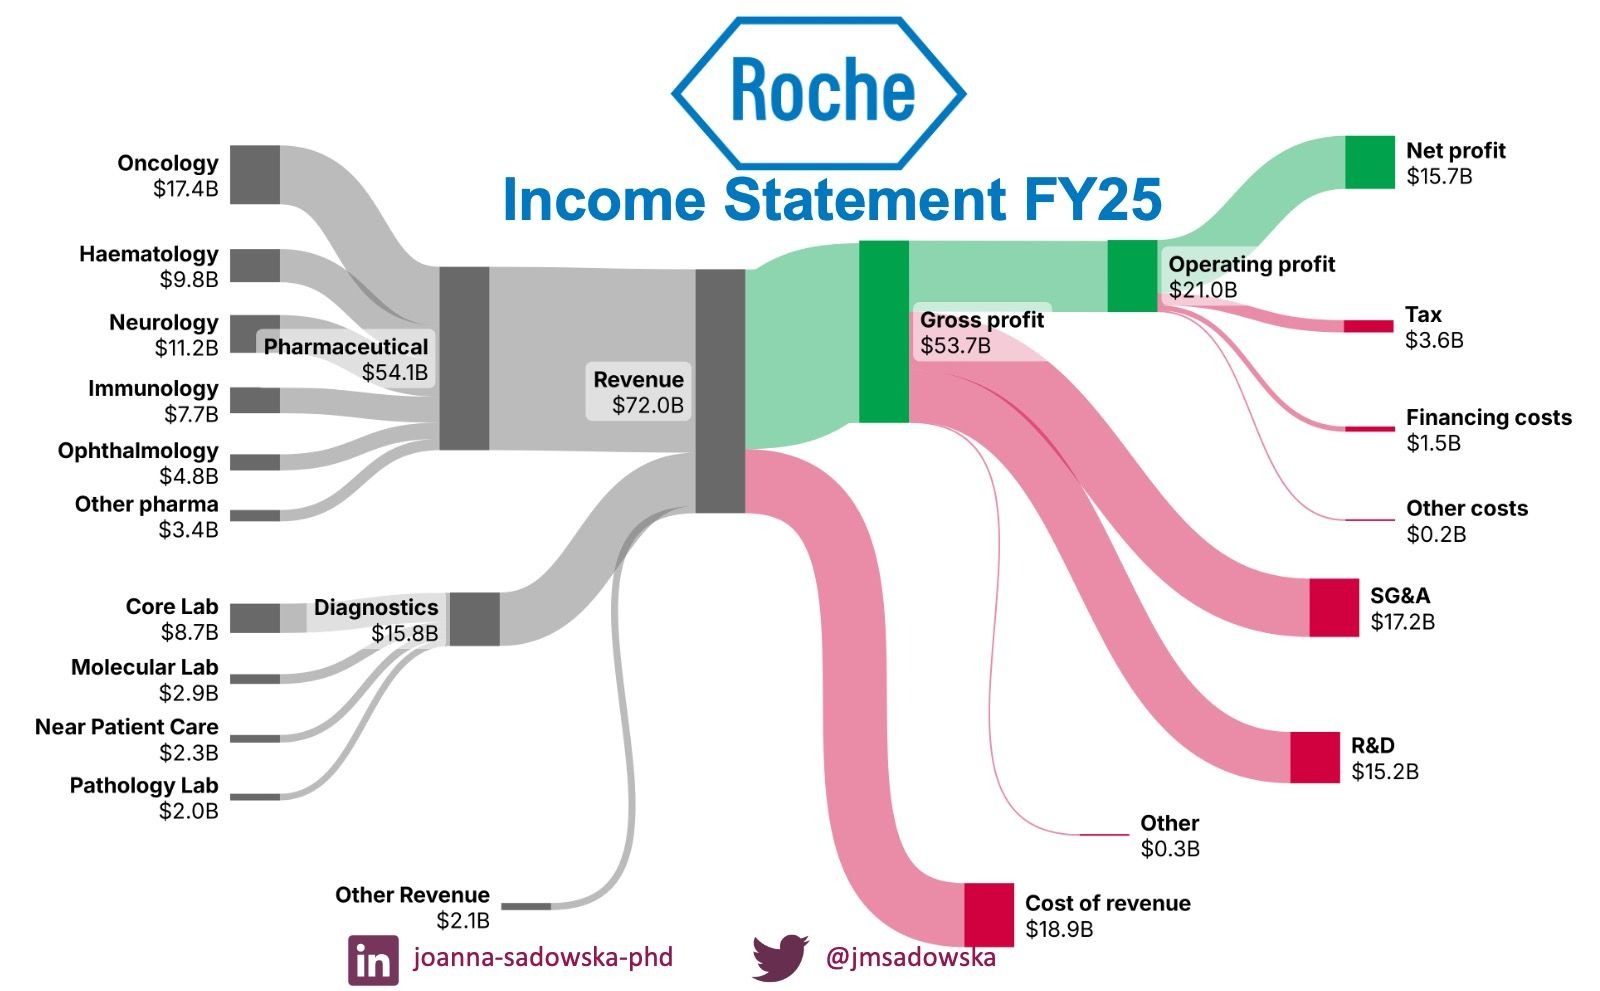
Roche, one of the world’s leading healthcare companies, reported its financial results for the fiscal year 2025 (FY2025), showcasing a robust performance across both its pharmaceuticals and diagnostics divisions. With total revenue reaching CHF 63.8 billion, the Swiss multinational demonstrated resilience in a competitive and evolving healthcare landscape. But how exactly did Roche turn this revenue into profit? A closer look at its income statement reveals the key drivers behind its financial success—sales growth, cost management, and strategic investments.
Revenue Streams: Where the Money Came From
Roche operates through two primary business segments: Pharmaceuticals and Diagnostics. In FY2025, the Pharmaceuticals division remained the dominant contributor, generating CHF 51.2 billion in sales, a 4.3% increase compared to the previous year. This growth was largely fueled by strong demand for key oncology drugs such as Tecentriq and Hemlibra, as well as continued uptake of newer therapies in neurology and immunology.
The Diagnostics division, while smaller, also posted solid gains, with revenues rising to CHF 12.6 billion—up 7.1% year-over-year. Growth here was driven by increased demand for molecular diagnostics, particularly in infectious disease testing and personalized healthcare solutions. The expansion of Roche’s diagnostics portfolio in emerging markets also played a significant role in boosting sales.
Geographically, North America remained Roche’s largest market, accounting for 45% of total revenue. Europe followed at 28%, while the rest of the world—including Asia-Pacific and Latin America—contributed 27%. Notably, emerging markets showed accelerated growth, particularly in China and India, where healthcare infrastructure improvements and rising patient access supported higher product adoption.
Cost of Goods Sold and Gross Profit
After accounting for the cost of goods sold (COGS), Roche reported a gross profit of CHF 52.1 billion, translating to a gross margin of approximately 81.7%. This high margin reflects the company’s focus on high-value, innovative therapies and efficient manufacturing processes. The pharmaceuticals segment, with its patent-protected drugs and premium pricing, naturally carries a higher gross margin compared to diagnostics.
COGS includes raw materials, production labor, manufacturing overhead, and logistics. Roche has invested heavily in automation and digitalization across its production facilities, helping to control costs and improve scalability. Additionally, long-term supplier agreements and vertical integration in certain product lines have contributed to cost stability.
Research and Development Expenses
Innovation is central to Roche’s business model, and this is reflected in its significant R&D spending. In FY2025, the company invested CHF 14.9 billion in research and development—representing 23.3% of total revenue. This level of investment underscores Roche’s commitment to advancing its pipeline, particularly in areas such as oncology, neuroscience, and rare diseases.
The R&D budget was allocated across multiple phases of drug development, with a growing emphasis on early-stage discovery and translational research. Roche also increased its collaborations with academic institutions and biotech startups, leveraging external innovation to complement internal efforts. While R&D expenses reduced short-term profitability, they are essential for sustaining long-term growth and maintaining a competitive edge.
Selling, General, and Administrative (SG&A) Expenses
SG&A expenses totaled CHF 18.6 billion in FY2025, accounting for 29.2% of revenue. These costs include marketing, salesforce operations, administrative salaries, legal fees, and IT infrastructure. Roche has implemented digital transformation initiatives to streamline operations and reduce overhead, particularly in back-office functions.
Marketing expenditures were focused on promoting key products in high-growth therapeutic areas and expanding market access in emerging economies. The company also invested in patient support programs and digital health tools, which help improve treatment adherence and outcomes—factors that indirectly support revenue growth.
Operating Income and Profitability
After deducting COGS, R&D, and SG&A expenses, Roche reported an operating income of CHF 18.6 billion. This represents an operating margin of 29.2%, a slight improvement from the previous year, indicating better cost control and operational efficiency.
Operating income is a critical metric for assessing a company’s core profitability before interest and taxes. Roche’s strong operating performance reflects its ability to balance investment in innovation with disciplined expense management. The company’s diversified product portfolio also helps mitigate risks associated with patent expirations or market fluctuations in any single therapy area.
Other Income and Taxes
Roche recorded CHF 1.2 billion in other income, primarily from investment gains and licensing agreements. The company holds a substantial portfolio of financial assets, including equity stakes in biotech firms and royalty streams from partnered products. These non-operating income sources contribute to overall profitability, though they are less predictable than core business revenues.
After accounting for interest expenses and taxes, Roche reported a net income of CHF 15.4 billion for FY2025. The effective tax rate was approximately 18%, slightly lower than the previous year, due to favorable tax rulings in certain jurisdictions and increased R&D tax credits in Switzerland and the United States.
Key Takeaways
- Revenue Growth: Roche achieved CHF 63.8 billion in total revenue, driven by strong performance in both Pharmaceuticals and Diagnostics.
- High Gross Margin: An 81.7% gross margin reflects the company’s focus on high-value, innovative products.
- R&D Investment: CHF 14.9 billion was spent on research and development, underscoring Roche’s commitment to long-term innovation.
- Operational Efficiency: SG&A expenses were well-managed, contributing to a healthy operating margin of 29.2%.
- Net Profit: Net income reached CHF 15.4 billion, supported by core operations and strategic non-operating income.
FAQ
What were Roche’s main sources of revenue in FY2025?
Roche’s revenue came primarily from its Pharmaceuticals division (CHF 51.2 billion), led by oncology and neurology drugs, and its Diagnostics division (CHF 12.6 billion), driven by molecular testing and personalized healthcare solutions.
How much did Roche spend on research and development in FY2025?
Roche invested CHF 14.9 billion in R&D during FY2025, representing 23.3% of total revenue. This investment supports the development of new therapies and maintains the company’s innovation pipeline.
What was Roche’s net profit in FY2025?
Roche reported a net income of CHF 15.4 billion for FY2025, reflecting strong operational performance, effective cost management, and contributions from non-operating income sources.